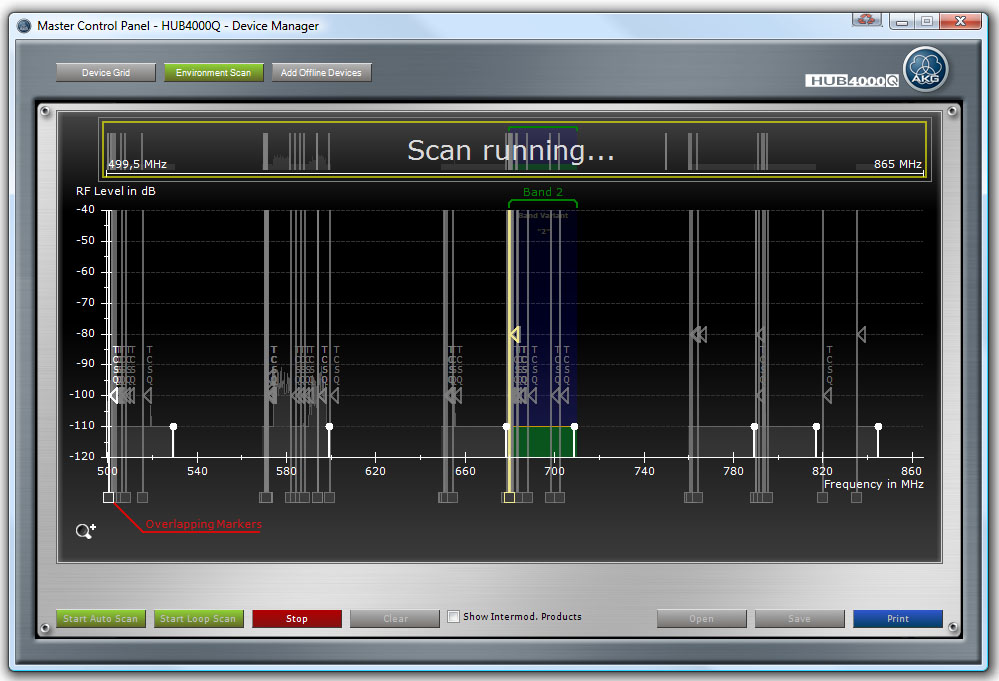
In the Frequency Graph the user can perform an Environment Scan and has a perfect tool to get an overview over the RF Environment in a graphical way. The entire RF frequency spectrum is displayed and can be zoomed in and out and searched through. The user can decide to get a overview over the entire RF environment with all used AKG Devices (Device Markers) or zoom in and scroll through the RF frequency spectrum to check in detail what the RF Environment is all about.

Figure: Device Manager - Frequency Graph with Environment Scan data
Selected Region Graph: The Selected Region is the main part of the Frequency Graph and shows all information which the user needs to see what's going on in the RF Environment. It shows information about all AKG Devices and Environment Scan data. The Selected Region can be easily changed with the scroll bar at the bottom of the Frequency Graph or with clicking into the Navigation Graph or with zooming in or out.
Device Marker: Each Device Marker is a graphic representation of an AKG Device. The Device Marker shows information about the RF settings of the AKG Device and is gray:
The horizontal position of the Device Marker shows the RF Frequency of the AKG Device in MHz.
If the AKG Device has a Squelch Level (e.g. SR4x00) then a small triangle shows the Squelch Level.
If the mouse hovers over a Device Marker it turns to white and some additional information displayed at the bottom of the Frequency Graph:
The name of the AKG Device, the AKG Device Type, the RF Frequency if AKG Device is in Tune Mode and the name of the RF Preset if the AKG Device is in Preset Mode.
If the mouse hovers over several Device Markers which are overlapping, meaning that the Device Markers are at the exact same RF Frequency or are so close together that it seems that they are on the same RF Frequency, at the bottom of the Frequency Graph the information will say "Overlapping Device Markers".
If user zooms into Frequency Graph than the Device Markers which are very close can may be seen separately.
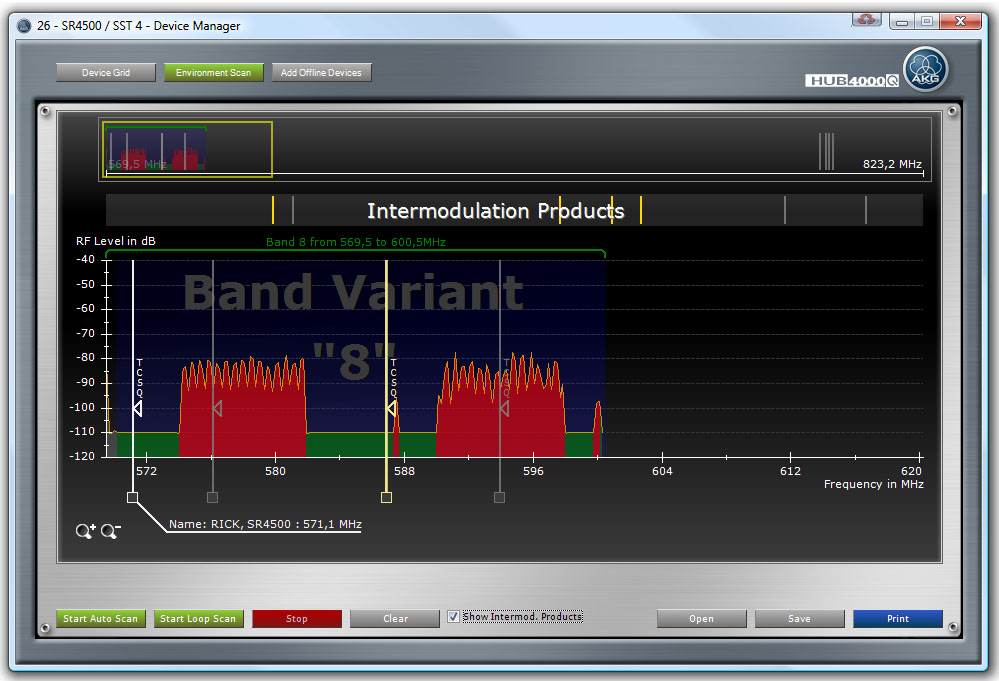
Selected Device Marker: The selected Device Marker is yellow. The Selected Device Marker is always the Device Marker of the selected AKG Device which is always the same for the Frequency Graph and the Device Grid. To select a Device Marker simply click on the Device Marker.
For the Selected Device Marker the following information is shown:
The Band Variant is written at the background.
The Band RF frequency range is shown with the green lines at the top of the Selected Region Graph. Within this RF frequency range the AKG Device is able to receive (DSR700, SR4000) or transmit (SST 4) RF signals.
The RF Frequency Limits are shown in blue. These are the RF Frequency Limits at which the user is allowed to set the RF Frequency at Tune Mode. This RF Frequency Limits must not be the same as the Band Frequency range.
The Environment Scan data for the Selected Device Marker is shown in green and red (all others are gray). The green portions of the environment scan data are portions which are under the squelch level of the Selected Device Marker which means that these RF frequency portions are right for setting there the RF frequency of the AKG Device.
The orange line shows the maximum value of the scanned data. This is important for Loop Scan where the orange line shows the maximum value at each RF frequency which was measured while Loop Scan was running.
If the portion is red than there is a higher noise floor than the Squelch level of the Selected Device Marker. The user shouldn’t set AKG Devices RF frequency inside these portions.
Navigation Graph: The Navigation Graph always shows the entire RF frequency spectrum of the wireless system. Device Markers are also displayed and environment scan data as well. At a glance the user knows instantly which selected Region he is looking at and it is easy to navigate through the entire RF frequency spectrum with zooming in and out and scrolling through the RF frequency spectrum.
With clicking into the Navigation Graph the Selected Region at the Selected Region Graph will be changed.
Zoom Region: The Zoom Region indicates which region of the RF frequency spectrum is currently shown at the Selected Region Graph. The yellow rectangle indicates the Zoom Region.
Zoom Icons: With the two Zoom Icons on the lower left part of the Frequency Graph the user is able to Zoom In and Out of the full RF frequency space of the wireless system.
Environment Scan: Scans the RF environment and the Environment Scan data is shown at the Frequency Graph. As long as no scan is conducted or started or scan data is loaded no scan data is shown at the Frequency Graph. If there is scan data available, either because of an Environment Scan is running or finished or scan data was loaded, the environment scan data is shown at the Frequency Graph.
Start Button: Starts the Environment Scan
Stop Button: Stops the Environment Scan
Clear Button: Clears the Environment Scan data
Loop Scan Active Check Box: If checked, Loop Scan is done. If not checked Auto Scan is performed if user starts Environment Scan.
Open Button: Opens a File Open Dialog to open previously saved Environment Scan data.
Save Button: Opens a File Save Dialog to save Environment Scan data.
Print Button: Opens a Print Dialog for printing the Environment Scan data.
Show Intermod. Products Check Box: If checked the Frequency Graph shows the Intermodulation Products of the actual RF settings of the wireless system. The Intermodulation Products are shown between the Navigation Graph and the Selected Region Graph. The yellow vertical lines are the Intermodulation Products of the Selected Device Marker and all other Device Markers. The gray vertical lines are the Intermodulation Products of all other Device Markers.

Figure: Device Manager - Frequency Graph showing Intermodulation Products